There are three types of abalone – Roe’s, greenlip and brownlip – that are taken by both commercial and recreational fishers in Western Australia. We manage both sectors together to help ensure long-term sustainability of stocks.
No abalone fishing, recreational or commercial, is permitted north of Moore River until further notice. This is to allow the Roe’s abalone population to rebuild after almost all abalone in the Kalbarri area died as a result of an ‘extreme marine heatwave’ – record high sea surface temperatures – in 2010/11.
In addition to this, recreational or commercial fishing for greenlip abalone between Busselton Jetty and Shoal Cape is not allowed. This closure came into place in 2023 and will provide further assistance to the arrangements in place to recover the greenlip abalone population within this region.
| Roe’s abalone |
29.7 tonnes
|
34.7 tonnes
(20.7 tonnes, Perth metro area; plus
14 tonnes in other regions – estimated)
|
|---|
Greenlip abalone
Brownlip abalone |
25.9 tonnes
13.1 tonnes
|
8 tonnes
|
|---|
We manage
recreational abalone fishing through size limits, daily bag and possession limits and closed fishing areas and seasons. Fishers also require a
licence to take abalone.
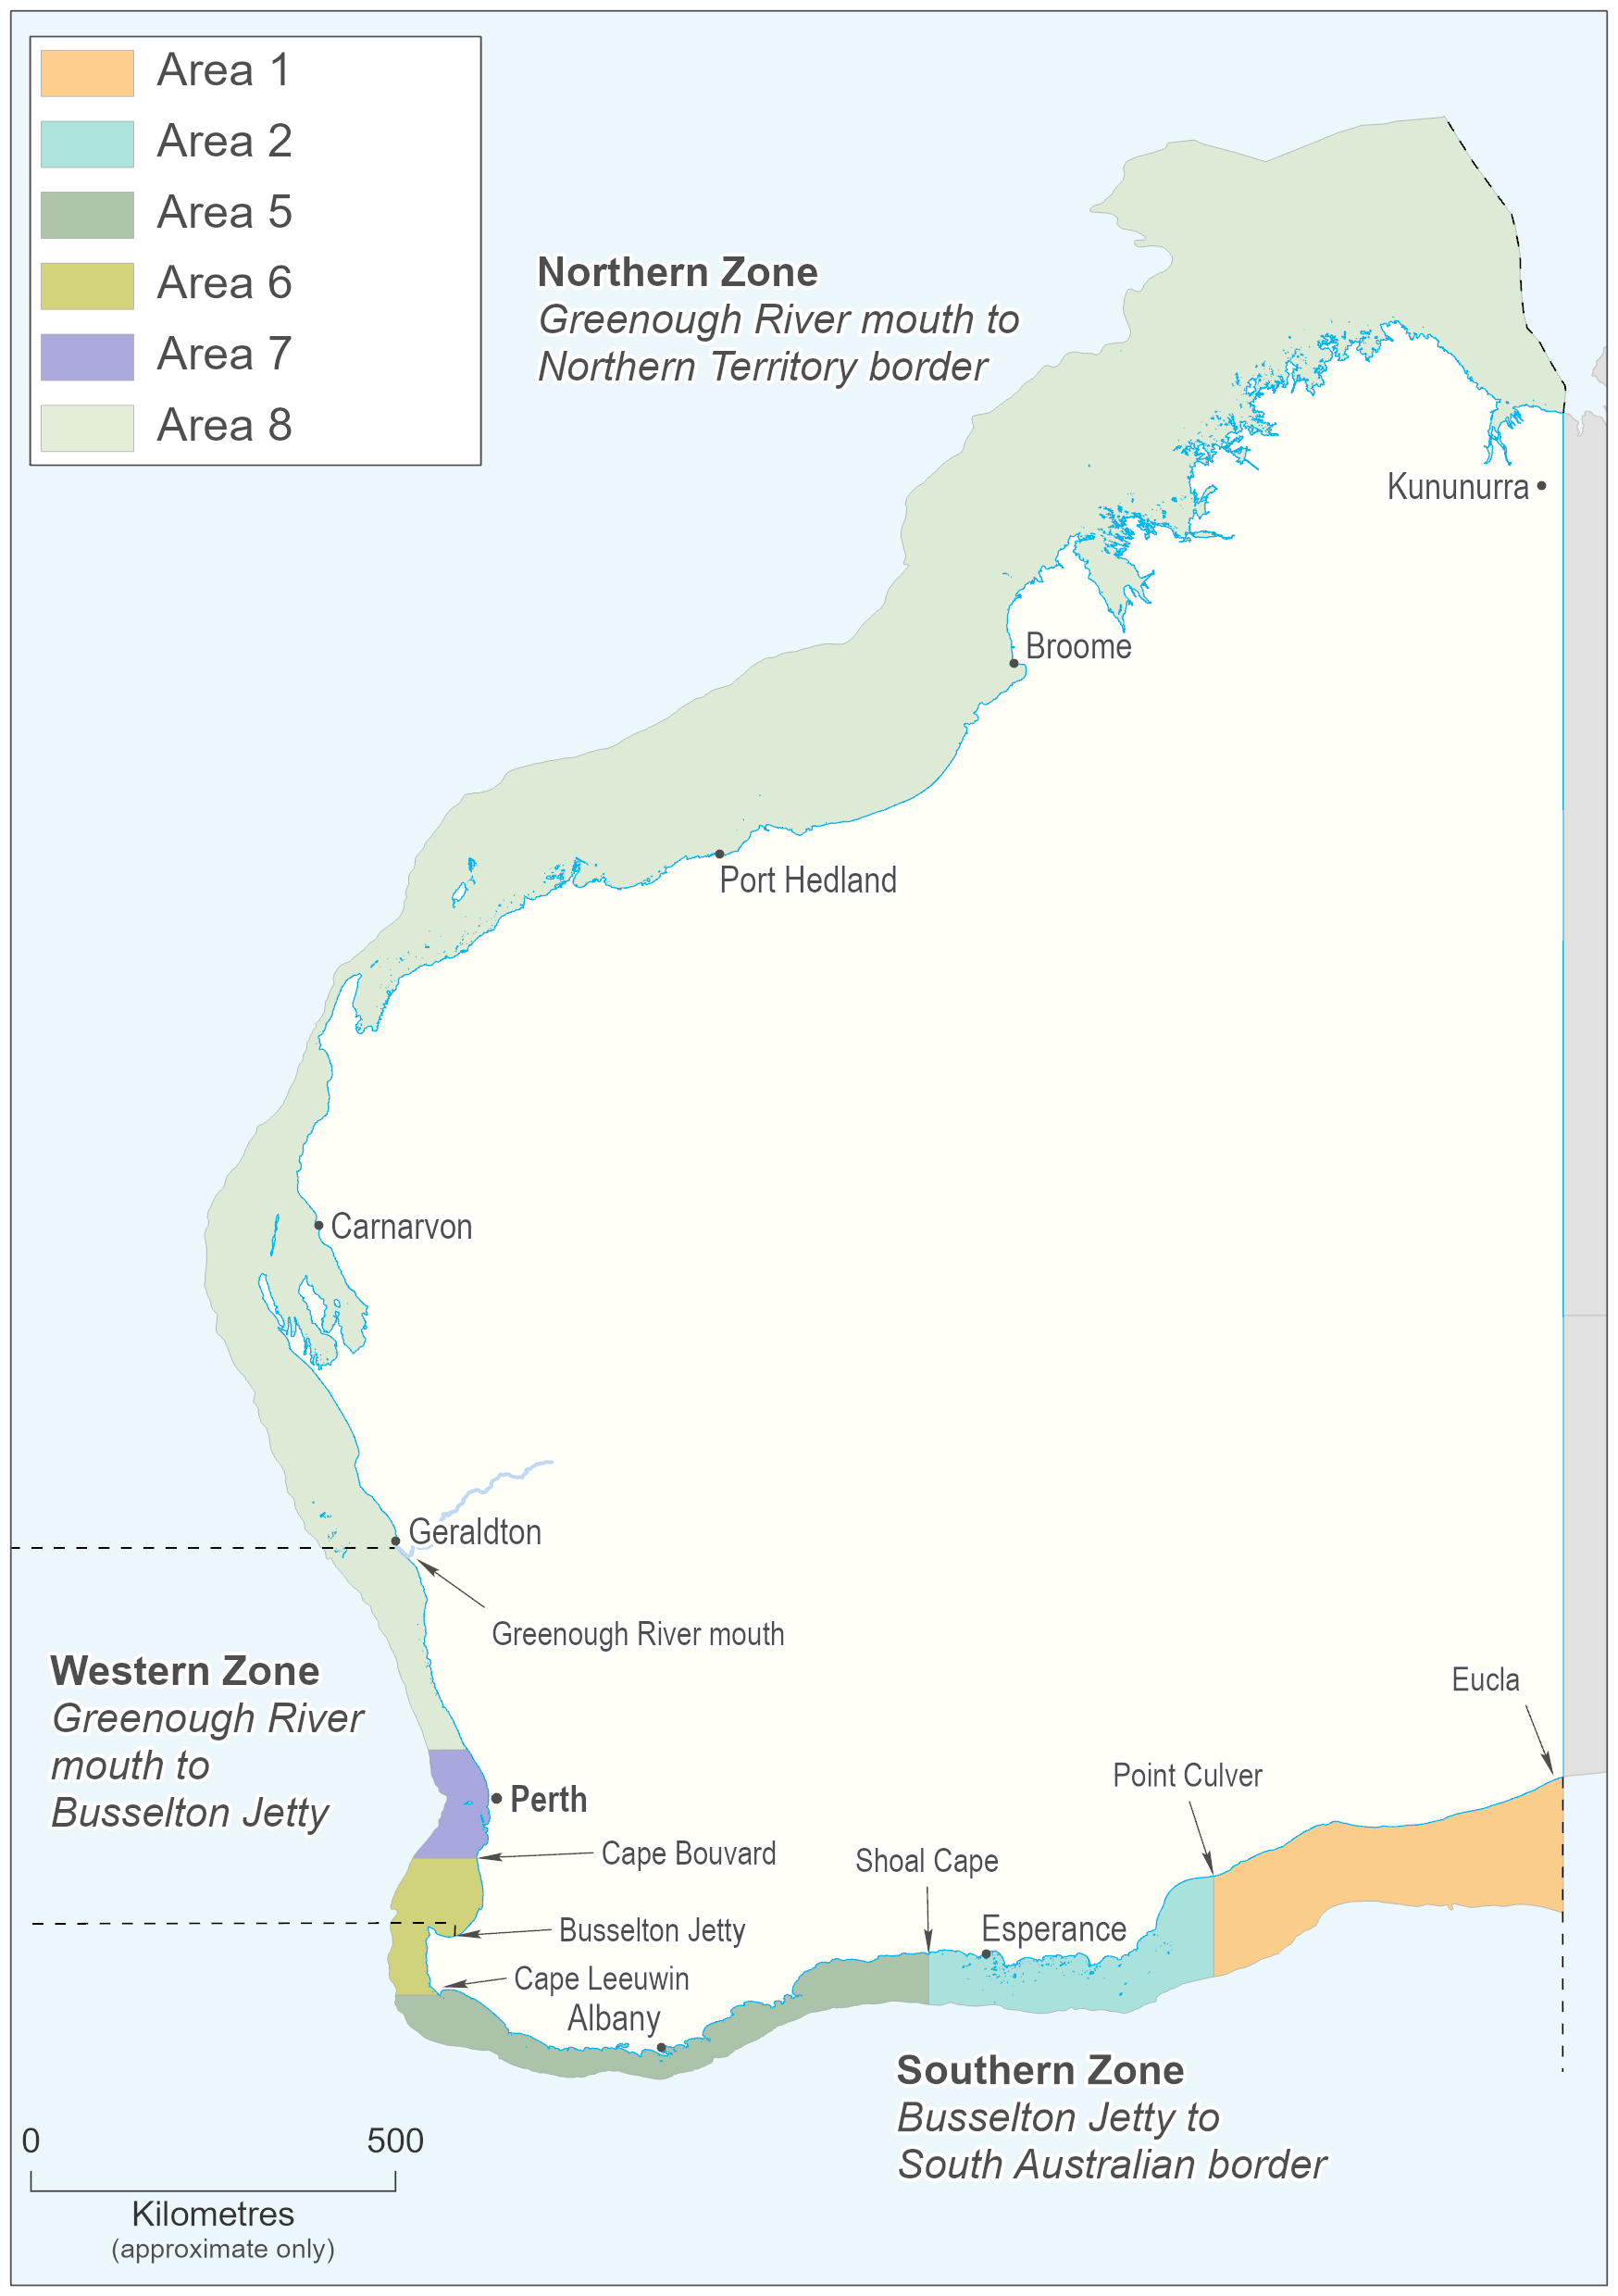
Recreational abalone fishing is managed in three zones: Zone 1 (Western Zone), from Busselton Jetty to the Greenough River mouth; Zone 2 (Northern Zone), from Greenough River mouth to the Northern Territory border; and Zone 3 (Southern Zone), from Busselton Jetty to the South Australian border.
No abalone fishing is permitted in Zone 2 (Northern Zone) or north of Moore River in Zone 1 (Western Zone) until further notice.
Greenlip and brownlip abalone are only taken in Zone 3 (Southern Zone), where fishing is permitted from 1 October until 15 May the following year. The area from Busselton Jetty to Shoal Cape is closed to greenlip abalone fishing.
Abalone stocks in Zone 1 (Western Zone) are vulnerable because they are located in our most populated regions, including off the Perth metropolitan coast, and easily accessible. To help keep stocks sustainable, fishing is only permitted for one hour a day on four Saturdays annually.
The commercial abalone fishery is divided into eight management areas (see the map below).
Commercial fishing management zones

Fishing is managed mainly through Total Allowable Commercial Catches (TACCs), set annually for each species in each area and allocated to licence holders as individual transferable quotas (units of entitlement). The number of commercial licences can vary over time, but the total catch is limited by the TACC. Minimum legal abalone sizes apply.
The total commercial catch of Roe’s abalone in 2021 was only 42 per cent of the TACC. This was a result of ongoing economic impacts of COVID-19 on overseas markets. The total 2021 commercial catch of Greenlip/Brownlip abalone was 80% of the combined TACC.
Aquaculture
Farmed abalone are not subject to size or quota restrictions.
Abalone farming is considered to have a relatively low environmental impact. Even so, there are strict management guidelines and legal requirements.
The Department is responsible for the environmental management of aquaculture in Western Australia. We manage environmental issues and biosecurity through Management and Environmental Monitoring Plans (MEMPs), which are prepared specifically for each aquaculture business, except for those growing prescribed fish on freehold land.
Monitoring, assessment and research
Stock assessments are carried out mainly by analysing data on catch and ‘effort’ (the amount of fishing) from commercial logbooks. The main performance measure for the abalone fisheries relates to maintaining adequate breeding stocks in each area. In 2021, abalone breeding stocks for Roe’s and brownlip were assessed as adequate, while greenlip was assessed as inadequate.
WA abalone status 2021
| Roe’s abalone |
Adequate |
Acceptable
|
|---|
Greenlip abalone
Brownlip abalone |
Inadequate
Adequate
|
Not acceptable
Acceptable |
|---|
For Roe’s abalone, breeding stock status is assessed using a combination of the level of quota achieved and the effort required to achieve the quota, both of which reflect stock abundance. Catch per unit effort (CPUE) – the number or weight of the species caught by a unit of fishing effort, such as the amount of time spent fishing – is assessed as part of a weight of evidence approach. Other components that feed into this include determining spawning biomass, density of harvest-sized Roe’s abalone and how the relationship between changing environmental conditions affect stock recruitment.
These stock indicators have been developed in a catch-prediction model, based on environmental conditions, for the Perth metropolitan fishery, that informs management decisions for recreational abalone fishing.
During the short recreational abalone fishing season along Perth reefs, a field survey is carried out to count the numbers of fishers on reefs and also count and weigh their catches. A phone-recall survey is also occasionally used to estimate the Statewide recreational abalone catch.
The size and density of Roe’s abalone is measured annually at 13 indicator sites, including two unfished (protected) areas, between Mindarie Keys and Penguin Island.
For greenlip/brownlip abalone, breeding stock status is assessed using a combination of measures that reflect the average size of breeding individuals and the overall biomass (the estimated total mass of the species in an area) of breeding stock.
The weight of abalone meat harvested is also calculated and length-frequency sampling (measuring the size of animals caught in the fishery) is done.
‘Mark-recapture’ analysis for growth and mortality estimates of greenlip and brownlip abalone – identifying the animals with an external tag and measuring the size and number of them in the same area over time – is also carried out.
In addition, commercial abalone divers supply a random selection of abalone shells from each fishing day, which are measured and used to estimate fishing mortality (the amount of animals removed by fishing).
The size and density of greenlip abalone is measured by our researchers from 140 sites across the fishery over varying time periods.